
1. The Evolution of Odds Compilation: From Intuition to High-Frequency Algorithmic Feeds
To consistently beat sports betting markets, one must first demystify how the counterparty manufactures their prices. In the early and mid-twentieth century, odds compilation was an artisanal craft. On-course bookmakers and racetrack oddsmakers relied on subjective experience, handwritten ledger books, and instinct to price outcomes and manage liabilities on the fly. Bookmakers aimed to balance their financial books manually, adjusting payouts as physical wagers crossed the counter.
A sportsbook can create prices internally, license a feed, reference other markets or combine these approaches. This article does not establish a market share for any sourcing model. A provider name does not identify the operator’s full pipeline, and a common feed can make quotes correlated rather than independent evidence. For comparison, record the market, timestamp, source and settlement rule, not merely the brand.
Understanding this multi-stage compilation pipeline allows quantitative bettors to identify structural inefficiencies, latency gaps, and market mispricings before the sportsbook has time to react.
2. The 5-Stage Mathematical Pipeline of Odds Creation
Modern sports betting lines are not pulled from thin air or public sentiment. They pass through a rigorous, sequential five-stage mathematical and operational pipeline before appearing on your betting app screen.
Stage 1: Raw Probability Generation via Statistical Modeling
A statistical model produces estimates, not objective probabilities known without error. Independent Poisson goal counts with a Dixon-Coles low-score correction are one possible football model; they are not a claim about every operator’s production system. The correction parameter is not a Pearson covariance. The model’s assumptions, fit window and out-of-sample performance must be documented separately.
The mathematical model decomposes team performance into attacking strength (), defensive vulnerability (), and home ground advantage (). It outputs a raw vector of fair outcome probabilities: such that . At this initial baseline stage, the probabilities contain exactly zero bookmaker margin.
Stage 2: Exogenous Information & Qualitative Adjustments
Raw statistical models, no matter how sophisticated, reflect historical performance data. However, sporting events are subject to real-time exogenous shocks. In the second stage, quantitative traders and automated scraping tools feed non-statistical information into the baseline model:
- Lineup Confirmations & Team News: The absence of a world-class playmaker, central defender, or starting goalkeeper significantly alters team attacking and defensive coefficients.
- Tactical Matchups & Schedule Congestion: A club playing its third match in seven days or rotating heavily ahead of a decisive Champions League tie requires downward rating adjustments.
- Environmental & Weather Conditions: Extreme rainfall, high altitude, freezing temperatures, or deteriorated pitch conditions structurally suppress total goal expectancy, inflating the probability of low-scoring draws.
- Referee Assignment: Historical referee foul-to-card ratios and penalty award frequencies are integrated into proposition and disciplinary markets.
Stage 3: Injecting the Vigorish (Overround Decomposition)
Once the sportsbook establishes its final estimated true probabilities (), it must inject its commercial profit margin (the overround or vig). To convert fair probabilities into retail decimal odds, the bookmaker scales the implied probabilities so that their sum strictly exceeds 100%:
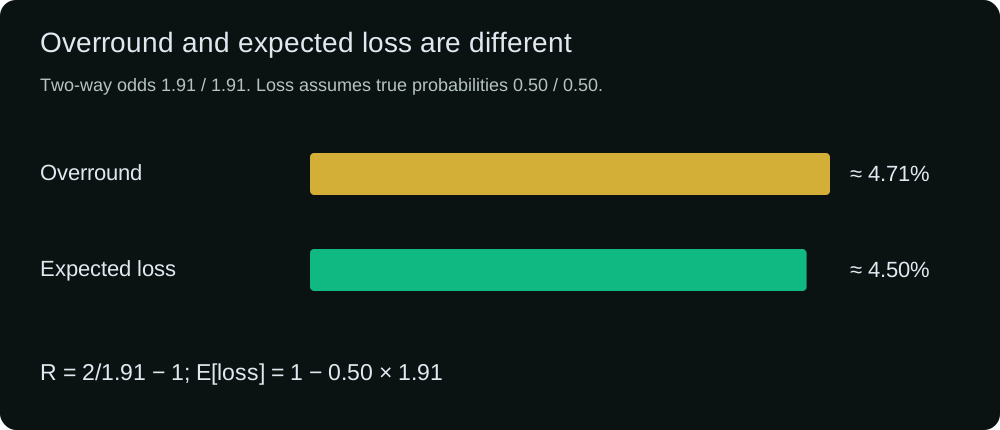
Margin allocation is a model choice. Proportional scaling, equal additive deductions and nonlinear transformations produce different distributions for the same quoted overround. Favourite-longshot effects must be evaluated on a defined dataset; they do not establish universal percentage charges on favourites and underdogs. An individual selection’s expected return still depends on its probability, not just the total excess of inverse prices.
Stage 4: Market Opening & Price Discovery with Low Limits
When a bookmaker first publishes betting odds (often several days or weeks prior to kick-off), uncertainty regarding true market efficiency is at its peak. To protect against latent model errors or non-public syndicate information, sportsbooks utilize low wagering limits during market opening.
Opening limits are an execution variable, not a universal dollar range. A quote can be visible while the requested amount is rejected or repriced. Record both offered and accepted prices and stakes. Early orders can contribute information, but the quote history alone does not prove the bettor’s identity, the operator’s motive or the direction of a future correction.
Stage 5: Dynamic Risk Management & High-Limit Line Movement
Prices and available stakes may change before an event. News, orders, provider updates and liability management are possible mechanisms. Their relative importance must be measured, not inferred from one movement. No fixed last-day liquidity surge, typical delay or maximum accepted amount is established here. Suspensions and missing observations also matter when reconstructing a usable line history.
3. The Myth of the "Balanced Book"
A balanced liability book is a conditional construction. For a complete market with odds and total turnover T, allocating stakes proportional to gives each winning outcome the same payout , where . If S>1 and all bets stand with no fees or voids, net revenue is in every state. Equal money on each side does not generally achieve equal liability. Actual accepted stakes need not have this allocation.
If a bookmaker attempted to balance its book on every Manchester City match, it would be forced to shade City's odds down to ridiculously uncompetitive prices (e.g. 1.08 instead of 1.25), completely destroying turnover. Instead, modern bookmakers use sophisticated risk engines to take calculated directional positions against recreational square money.
An unbalanced book retains outcome risk. Positive quoted overround alone cannot guarantee profit against an arbitrary probability vector or stake distribution. Expected operator revenue is total stakes minus probability-weighted payouts; realized hold is the actual net revenue divided by turnover. These quantities can differ from the quoted overround, and the operator can lose on a particular event or period.
4. Sharp vs. Soft Bookmakers: Two Polar-Opposite Business Models
Sharp and soft are informal labels used in market discussion. Compare measurable properties rather than assume two exhaustive or certified classes.
| Question | Evidence to record |
|---|---|
| Quoted margin | Complete outcome prices, timestamp and computed sum of inverse odds. |
| Execution capacity | Requested and accepted stakes, prices and account-specific terms. |
| Price formation | Source and synchronized changes; do not infer the entire provider pipeline from a label. |
| Forecast quality | Held-out calibration and scoring results with uncertainty and dependence accounted for. |
| Promotion | Current eligibility, settlement and withdrawal terms; an advertised bonus is not model EV. |
“Sharp” and “soft” are informal market labels, not certifications or two exhaustive classes. An operator can use different prices, providers and limits across products. A benchmark is useful only if its source, timestamp and forecasting behavior suit the comparison. The table describes questions to check rather than measured universal properties of named companies.
5. How Profitable Bettors Exploit the Compilation Process
Armed with an understanding of how odds are compiled, quantitative bettors deploy specific strategies to capture positive mathematical expectation (+EV):
- Price differences need synchronized quotes and matching settlement. A stale-looking price alone establishes neither latency nor positive EV.
- A future no-vig close is a retrospective benchmark, not a probability known when placing an earlier bet. Positive CLV does not guarantee profit.
- No percentage of operator resources devoted to any market is established here. Smaller markets can differ in data, liquidity and settlement; test their forecasts separately.
- Use the linked no-vig calculator to compare named models. Its normalized output is conditional on assumptions, not a recovered true probability. No-Vig Fair Odds Calculator
6. Summary & Key Takeaways
Odds are not predictions of what will happen; they are equilibrium pricing instruments designed to extract a statistical toll from market participants while managing downside volatility for the operator. By viewing odds through the lens of mathematical compilation, the bettor transitions from a recreational gambler hoping for luck into a disciplined quantitative operator exploiting market structure.
For a hypothetical two-outcome market, set each odd to 40/21. The inverse-price sum is 1.05. With 210 units of total stakes split equally, either winner receives 200 and the operator retains 10 before costs. The revenue fraction 10/210≈4.7619% differs from quoted overround 5%. This state-independent result relies on the stated balanced allocation and no fees or voids. A different stake allocation can change the profit by outcome.